
Vendor Scorecarding Techniques to Improve Collateral Recovery Results
From our position as a national repossession management firm in the industry, we have been exposed to virtually every type of vendor scorecard model in use. Some of these models focus solely on recovery performance, while there are some that focus deeply and more diligently on regulatory/SOW compliance. Regardless of the depth of the scorecard report, vendor scorecarding is an essential analytical tool for the modern vehicle repossession and recovery industry that is not only a scoreboard, but a compass that guides recovery departments to more successful results.
As previously mentioned, developing vendor scorecards can get into great detail or be very simple. This is based solely upon the needs and purpose of the lender. The rest of this article will examine the different levels of vendor scorecards we see used across the auto finance industry. From basic to more complex scorecards, we’ll discuss the various metrics in each methodology and its effectiveness in improving collateral recovery results.
Basic Level Scorecards
At the minimum, a “Closed Batch” scorecard methodology is effective and should keep record of just the basic vendor recovery results;
- Total Assignments
- Open Assignments
- Closed Assignments
- Average Days to Recovery (DTR) – This does not count into the developed score.
- Total Recoveries
- Recovery Ratio or Percentage
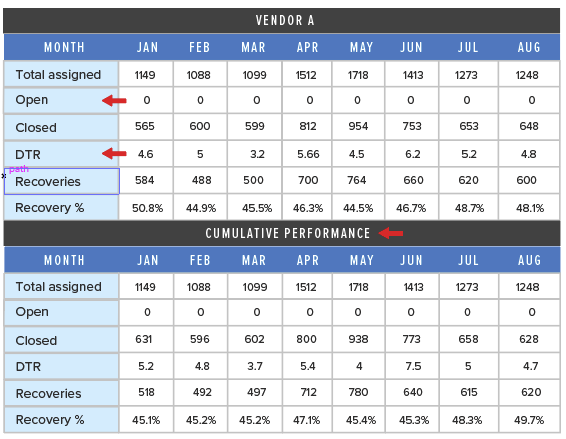
The key to the “Closed Batch Scorecard” methodology, is in only using assignments that have been closed or recovered. Including open account data in this model can create unreliable results, as the open accounts are still moving targets and suppress the true recovery ratios.
Another key item to point out in this model, is the lender has incorporated days to repo (DTR) on the scorecard, but it does not have an impact on the performance score. DTR is a meaningful performance indicator, but not always a fair metric in that an agent’s diligence in recovering a unit after three weeks of effort is punished, while had it not been recovered, it would simply be swallowed by the larger pool of unrecovered assignments.
As a practice, this lender leaves their assignments with each vendor for 21 days, with a multiple tier placement strategy (1st, 2nd, 3rd). Tracking tiers separately is important if employed, as recovery results traditionally diminish with each placement.
Many, if not most, lenders share their scorecards with their vendors displaying their competition’s results either line by line, or simply as an aggregate or cumulative average of them. It is not suggested that actual vendor names be shared, but rather identified in either alpha or numeric values (A, B, C, 1,2,3). Based on the results of the head to head competition, the recovery department can then, at their discretion, make informed strategic decisions on market share assignments to their best performing agents in the attempt to achieve the same results across a broader group of their portfolio.
The downside of this minimalistic report approach, is that it does not measure the obvious performance variances of Voluntary and Involuntary assignment types and focuses solely upon the gross recoveries. By failing to bifurcate assignment types the results distort the report results at numerous levels. The simple answer to this, is the duplication of the report along the lines of assignment type.
Intermediate Level Scorecard Examples
More effective and Intermediate level scorecards track the Voluntary and Involuntary repossession results separately, and are the only fair and objective way to scorecard your recovery agents.
A better developed intermediary level scorecard contains;
- Columns for Voluntary and Involuntary Assignments
- Columns for Recovered Voluntary and Involuntary Assignments
- Columns for Average Days to Recovery (DTR) by each category
- Columns for Recovery Ratios (%) by each category
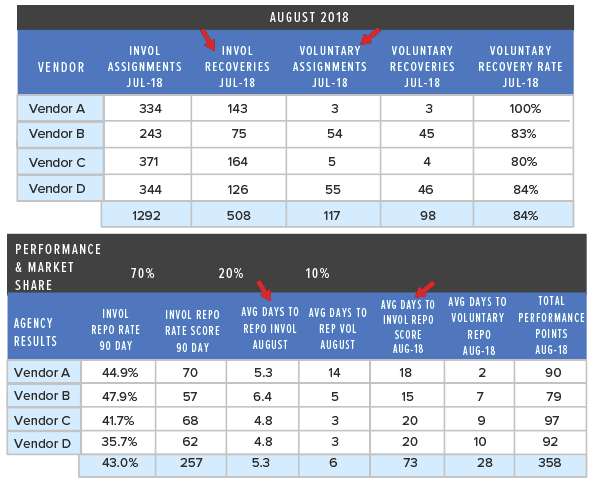
Incorporating each of these recovery elements into a scorecard allows for the placement of weighted ratio values to each of these performance metrics to create a final score. These weighted values are at the discretion of the lender and can vary from organization to organization.
Unlike the last scorecard, Days to repo (DTR) does have an impact here, and has a 10% weighting value to the overall score. Also maintained in this scorecard model is a 90-day cumulative average score, which is used as the basis for vendor performance scoring. This method reduces month to month volatility in rankings and works especially well with smaller pools of assignments by softening erratic variable results.
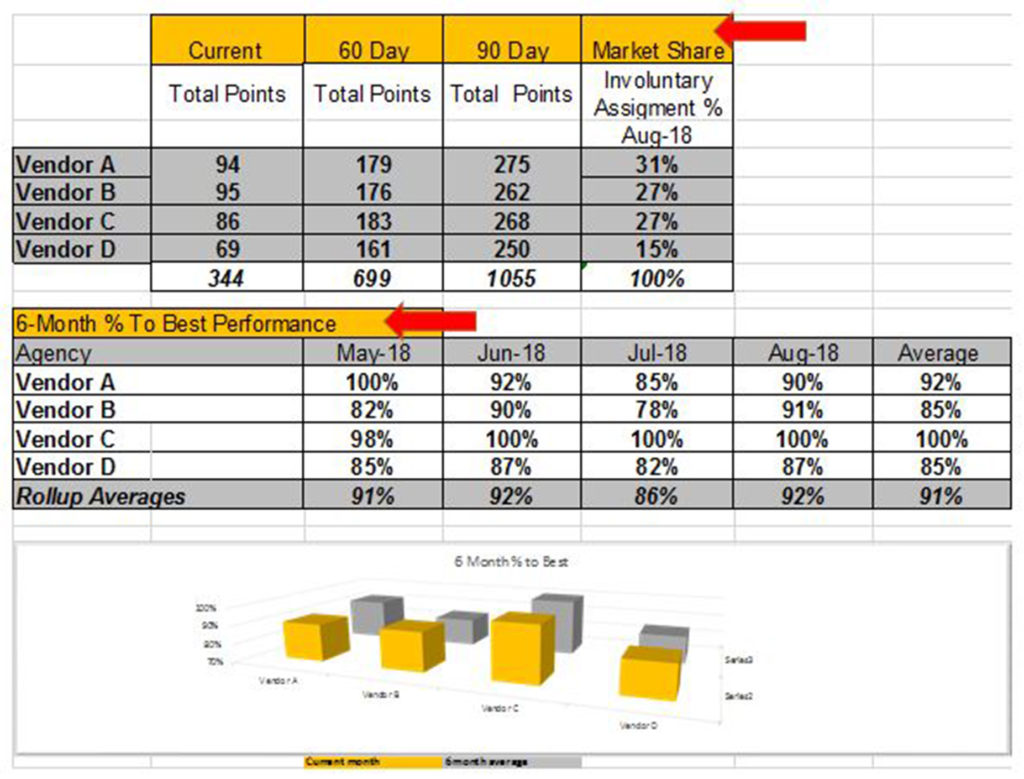
Another unique detail in this scorecard is its illustration of the application of vendor score to Market share. Using market share allocation based on performance is an obvious best practice. Rewarding the best performers with more business, is good business, for lender and agent alike. As a nationwide skip tracing and repossession management provider, this is our preferred method of reward from our clients.
Complex Level Scorecard Examples
Some lenders prefer a more complex, performance-based scorecard, with several unique details.
- Assignments and Recoveries divided by Placement Type – This practice measures more structured repossession strategies that employ multiple agency assignments over set period of time.
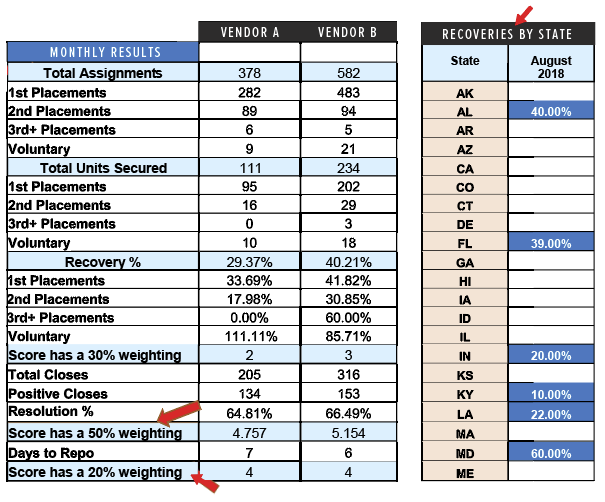
Assigned to each of the above elements, are weighted score values used to determine the final vendor scores. In this case, the recovery ratio has a 50% weight, followed by 30% for positive resolution (paid current) and 20% for Days to Repo (DTR). These weighted score values are all very dependent upon the lenders desired areas of focus and could vary with different lenders.
With a growing number of lenders, this model is also applied on a state by-state basis to account for varying recovery results experienced across the nation. These scores are then applied strategically and proportionately in the applicable service areas. In perfect honesty, these reports could drill down as deep as the city or zip code levels if desired, but we have not seen this yet.
As illustrated, scorecards can dig down into great minutia of variables and their grading methods of a vendor depend upon a lender’s vendor management strategies and areas of focus. Keeping this in mind, the working validity of any scorecard model can be erratic with small pools of data, where low volume experience can create wild variances to averages. In these cases, the long view, of a 3 or even 6-month average, can soften these variables and create a more objective and reasonable view of a vendor’s performance.
Advanced Level Scorecards
The ever-growing presence of compliance has also found its way into scorecarding. This has forced full-service repossession management firms like ourselves, agents, and others alike to meet a variety of compliance metrics. We have seen several lenders who are measuring this monthly using four different areas of focus.
Regulatory Compliance
While not as obvious in status as a recovery ratio, the manner and level of compliance that a vehicle repossession agency functions at is becoming a critical element of their service measurements with profound consequences. While the weighting of these elements is always subjective to the lender, these facets of performance are arguably equal in importance to the overall services provided.
- Repossessions in Error – Wrongful repossession
- State Requirements – Licensing, taxes paid
- Personal Property Notification – Timely and professional notices provided to the borrower.
- Late Repossession Reporting to Lender – Reporting beyond the agreed upon post recovery timelines.
- Account Closures – Errors in keeping accounts open after close.
- Call Monitoring – This breaks into many subsections with the common intent of assuring that borrower verification protocol and professional communication is maintained and provided accurately.
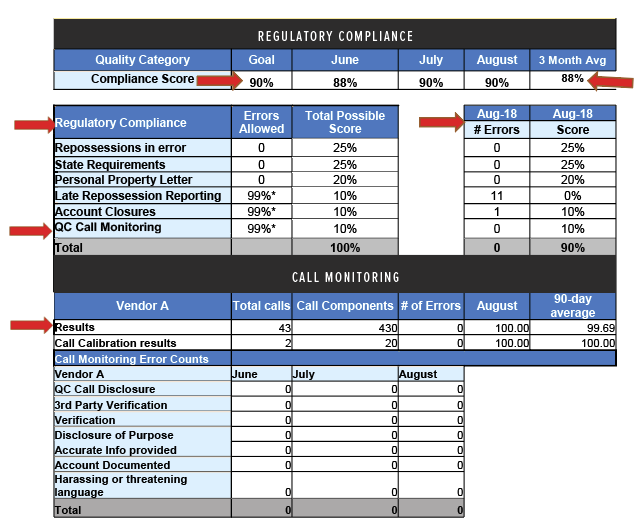
The measurement of telephone communications is important in determining that a lending institution’s service level agreements (SLA’s) are maintained. In this age of hypersensitive regulatory compliance, lenders must receive more than a car repossession result, they must also be provided a complaint and professional service.
Incident Activity
While a rare scorecard, some lenders scorecards track very important borrower facing statistics that weigh heavily as elements of risk associated with potential litigation. Based upon borrower complaints, this card focuses on reported alleged negative car repossession and post recovery incidents. While only allegations on the surface, they can illuminate higher than their peer complaint ratios and be cause for concern.
- Agent Related – Complaints regarding agent activity
- Fees – Fees charged to a borrower not previously agreed to by the lender
- Personal Property – Missing or damaged property
- Vehicle Damage – Borrower complaints of damage occurring during or post repossession
- Property Damage – – Borrower complaints of damage to their property occurring during the recovery attempt
- Repossession in Error – Wrongful repossessions
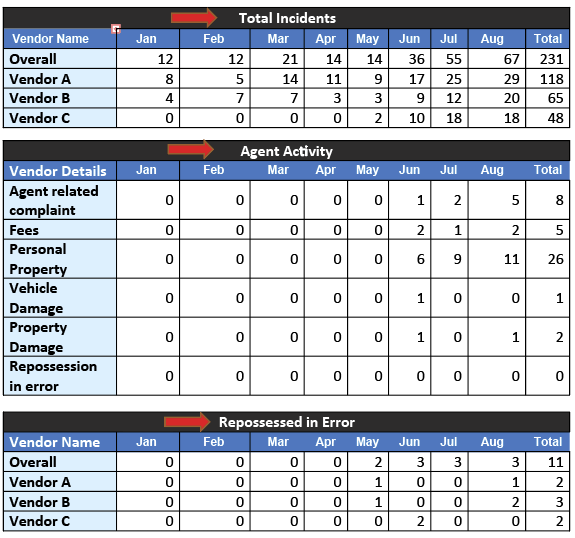
Every lender has its own unique problems and, on this scorecard, “Repossessions in error” has its own section, indicating that this seems to be a major issue with this lender, and not necessarily just with one agent. When verifiable complaint trends develop with a specific auto repossession agency, remedial action is suggested to avert the potential of future litigation. Never forget, a repossession agency, serves as a reflection of the lender with everything they do, good or bad. A well-managed recovery department tracks and responds to borrower complaints diligently and objectively to determine the veracity of borrower claims related to these issues.
Post Recovery Activity
Just as mentioned above, every lender has its own issues and on the below report, invoicing and condition reports are either a big enough service level issue to warrant their own report or, they’re just very diligent in tracking these service levels to assure they conform to their SLA’s.
Broken into three categories are;
- Invoicing – SLA Timeliness
- Invoice Accuracy – Consistent with fee schedules
- Repossession Report – Within an SLA 48 hours and likely including condition report and photos
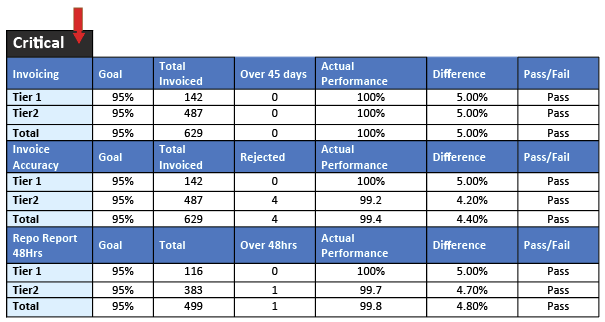
To a small lender, or one that conducts a low volume of vehicle recoveries, these may not seem worthy of reporting, but to a lender managing vehicle repossession volume on a larger scale, these numbers represent larger inefficiencies that create drag on departmental performance.
Non-Critical Duties
While these are non-critical items to track, they are good measurements of a vendor’s relationship to the lender and their communicating of updates, a frequent sore spot for collections and recovery staff both, as well as completion of post recovery functions.
- Assignment acceptance – Has the vendor turned down work
- Repossession updates – Field recovery agents updates
- Impound updates – This lender has a 48-hour requirement for updates.
- Skip update. This lender has a 14-day update requirement.
- Condition Reports – The final communication step in the recovery process
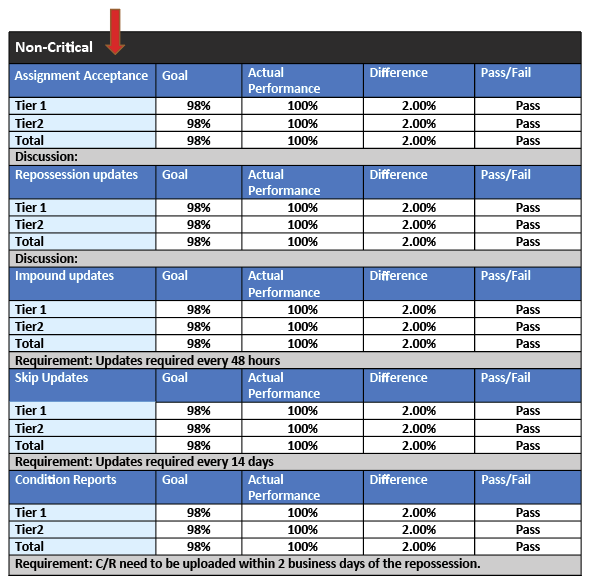
While these reporting elements may not seem as critical as some of the others listed above, keep in mind, as mentioned before, on a larger scale, these issues multiply and create a lack of consistency creating more work on the lenders end, reducing efficiency. Measuring service level agreements (SLA) is the only way to ensure they are adhered to.
Scorecard Application
The above examples are by no means exhaustive and there are still many more elements of measurement that could be used. The big question is, how do you employ this data to optimize your vendor performance?
Competition brings out the best in athletes and does the same in business. Keeping score of, and sharing your vendor performance scores is really only fair. These scores provide your vendors with measurable head to head results that can be used to help them focus on improving their own businesses while also allowing the lender the ability to manage their resources and allocate assignments in a manner most likely to provide them the best end results in a timely and successful manner by their vendors.
In application, scorecard results are best practiced using the following strategies;
- Multiple Vendors – It is always a best practice to have multiple nationwide repossession management firms or recovery agents working your portfolio. This gives you the ability to rotate assignments by using a tier strategy. It is important that you do not exceed your assignment volume limitations per vendor, too much volume may tax their resources and create negative results.
- Tiered Rotation – We have found that a multi-tiered placement strategy is optimal (2 pre-charge off, and 2 post charge off). In regards to pre-charge off, we have found that having one forwarding placement, and one pre-charge off skip placement actually generates a better result.
- Shorter Assignment Durations – As a best practice, forward assignments that have been with a vendor for no more than 30 days, and assign for skip tracing no more than 60 after the first assignment. The average recovery time on a 60-day delinquent repossession assignment is approximately 3-7 days. As loan delinquency increases, recovery ratios diminish and agents tend to lose focus on them as fresh accounts have higher recovery probabilities. It is in the best interest of both the lender and repossession agent alike, that assignments are rotated with predictable frequency.
- Closed Batch Measurement – Measuring recovery results by closed batches (no open accounts in the baseline denominator of assignments) whether 30, 60, or 90 days, depending on placement levels, provides the best measurements on how your vehicle repossession vendors are actually performing. Measuring open assignments in their recovery ratio creates unfavorable variances from new assignments that the agent has not yet had fair time to recover.
- Monthly Scorecards – Issue scorecards monthly. Scorecards foster competition, provide feedback on performance, and coupled with a monthly call, help build relationships with agreed upon and understandable expectations. Quarterly scorecards leave your vendors with too little time to address operational or performance issues.
- Meaningful Reward/Penalty Based on Performance – The best method in rewarding good performance is increased market share allocation. This is also the best method of addressing performance deficiencies. It does, however, need to be significant and meaningful enough to enforce positive results, If not, there’s not much motivation for your vendors to maintain peak performance or remedy deficiencies. When used properly, performance-based market share allocation will drive stronger overall recovery results derived from the majority of assignments being managed by your higher performing vendors.
While there are some common denominators to every scorecard, standardized vendor scorecarding is unlikely unless it evolves from a regulatory mandate, which appears unlikely at this point. Every lending organization is unique in its processes, practices and specific areas of focus. That said, the scorecard reports managed by every lender should be a reflection of their particular needs.
What is clear, is that vendor scorecarding is an industry best practice that should be employed by all recovery departments and used as a transparent report of repossession production results and the measurement of service level expectations. By strategically allocating the highest volume of repossession assignments to the highest performing vendors, and within their manageable bandwidth, recovery departments can maximize their departmental efficiency and recovery results.
For more information of Scorecard Best Practices, please watch our previously broadcasted webinar of the same name, “Optimizing Repossession Results Through Effective Vendor Scorecarding” presented by our SVP of Operations, Ronald Eubanks and our CEO, Michael Levison.
Download a Copy of Our Whitepaper to Read
Get a PDF copy of our article to read later or share among your coworkers and colleagues. Should you have any questions, contact our team.
Our top ten Clients include three Forwarders/Nationals, and seven Direct/Captive Clients. Of these TWO share a monthly scorecard.
Thank you for pressing the importance of this topic. The most important factor is to SHARE this information with the “boots on the ground”.
[…] For more information on vendor scorecarding techniques, click here. […]